

Bring Salesforce data to life with dynamic charts inside Lightning pages! While Salesforce dashboards are powerful, sometimes business users want visual insights without leaving their current page. That’s where Chart.js with Lightning Web Components (LWC) becomes a game-changer.
In this step-by-step guide, you’ll learn how to:
-
Upload Chart.js as a static resource in Salesforce. -
Build an Apex controller to fetch real-time Opportunity data. -
Create a Lightning Web Component that renders an interactive chart. -
Deploy it directly inside Lightning App Pages, Record Pages, or Home Pages.
By the end, you’ll have a fully functional, real-time Salesforce chart using LWC and Chart.js, complete with dropdown filters, tooltips, and beautiful animations; ready to impress your users and stakeholders.
Step-by-Step Guide to Upload Chart.js as a Static Resource
Step 1: Download Chart.js
-
Go to the Chart.js official website. -
Download the latest chart.min.js file.
Step 2: Open Salesforce Setup
-
Log in to Salesforce. -
Click on the gear icon, then Setup.
Step 3: Navigate to Static Resources
-
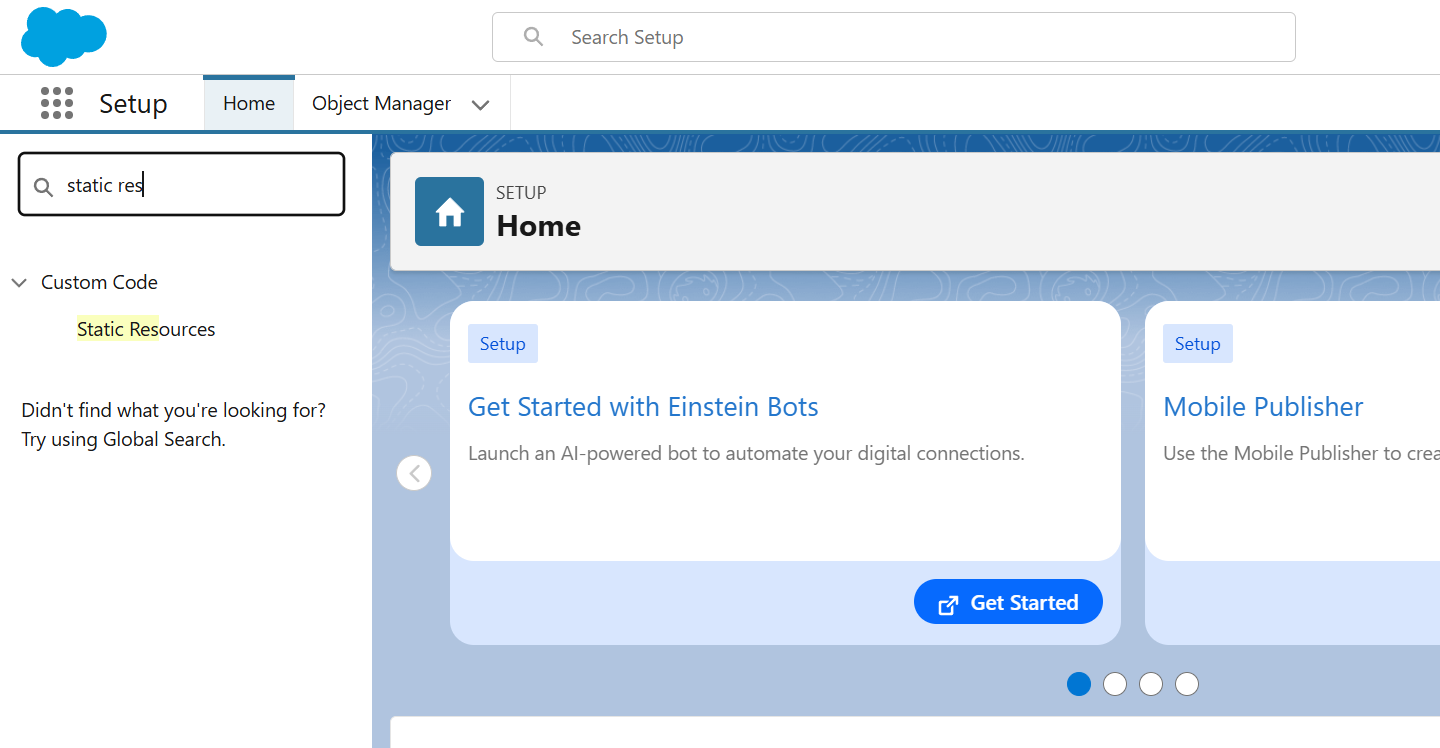
In the Quick Find box, search for Static Resources. -
Click New to create a new static resource.
Step 4: Upload the File
-
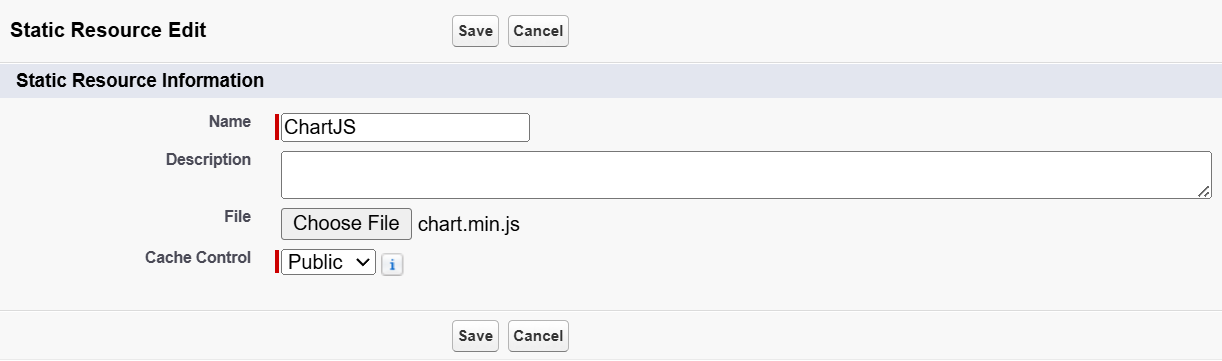
Enter Name: ChartJS (make sure there are no spaces). -
Click Choose File, then select the downloaded chart.min.js file. -
Set Cache Control to Public. -
Click Save.
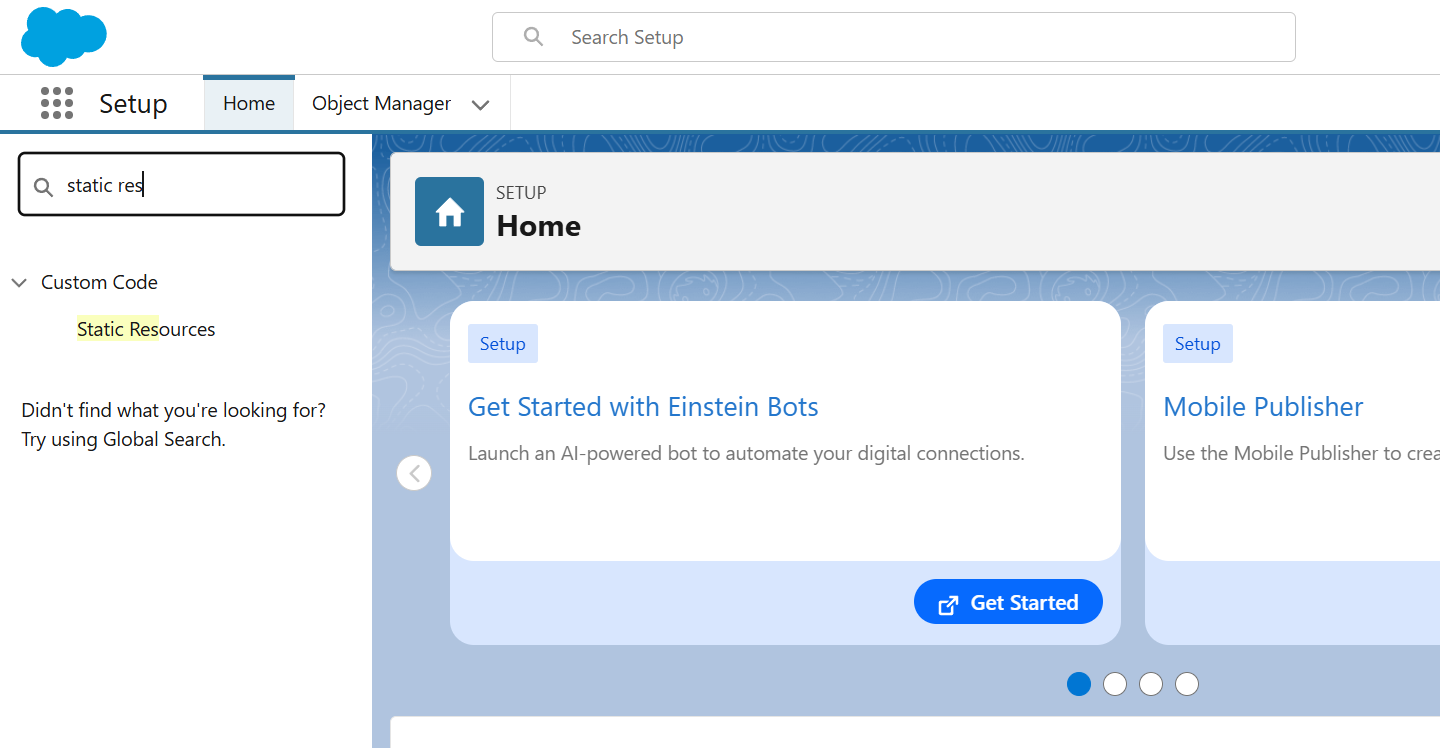
Step 5: Go to the Setup Tab in Salesforce.
Step 6: Search for Static Resource.
Step 7: Click on New Static Resources.

Step 8: Fill in the Required Details.
Once the Static Resources are set up, we can create a Lightning component and make an Apex controller.
Now, let’s take Salesforce Custom Object Opportunity and ensure you have Opportunities with Amount values in your org (otherwise the chart will be empty).
Step to Create an Apex Controller.
We need an Apex class to fetch the Opportunity data grouped by Stage. This class groups Opportunities by Stage and returns the label (stage name) + value (total amount).
Now, let’s build the Lightning Web Component.
Step to Create LWC (Lightning Web Component).
Since JavaScript is crucial in this case, we will begin with it next.
XML
Step 2: Deploy & Test
-
Deploy the Apex class and LWC bundle to your Salesforce org. -
Go to Lightning App Builder, then drag the chartDemo component onto a page. -
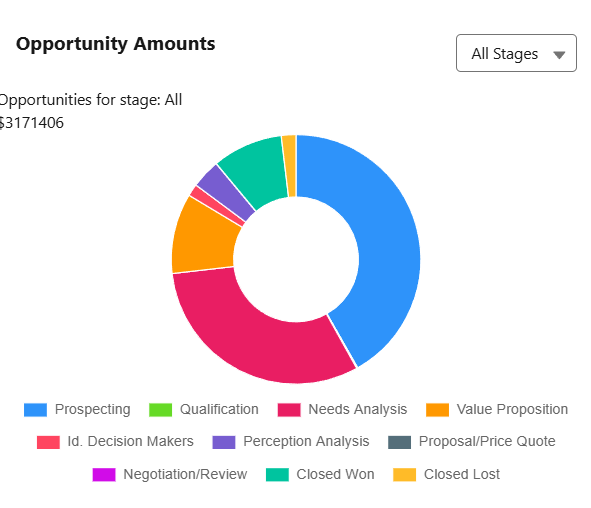
Open the page, and you’ll see your animated doughnut chart of Opportunity Amounts. -
Use the dropdown filter to switch between All, Closed Won, Closed Lost, etc.
Final Output
-
A dynamic, animated chart showing Opportunity Amounts by Stage. -
Supports filters from a dropdown. -
Automatically updates chart and total amount. -
Beautiful colors, tooltips, and animations using Chart.js.
And that’s it! You’ve successfully created an interactive, animated chart in Salesforce LWC using Chart.js.
Watch Live Demo Video:
Conclusion
And that’s it! You’ve successfully built a dynamic, animated Salesforce chart with LWC and Chart.js. With just a few steps, you can transform plain Opportunity data into meaningful visualizations right inside Lightning pages; no external BI tools are required.
This approach is flexible and reusable:
-
Replace Opportunities with Leads, Cases, or custom objects. -
Customize chart types (bar, line, pie, doughnut, etc.) -
Add more filters to make insights even more interactive.
By combining Salesforce data visualization with the power of Chart.js in LWC, you empower business users with actionable insights where they need them most. Try it in your org today, and take your Lightning Web Components to the next level!
👉 Looking to build tailored solutions like this for your business? Explore our Salesforce Development Services and let our experts help you create scalable, future-ready apps that drive results.